Turn any chart into a shareable table in seconds. You can now open the underlying data for every Kinabase chart and export it to CSV for deeper analysis or quick sharing.
Need the exact figures behind that bar chart? Click View data and the full, formatted table opens instantly, complete with units, date precision and multi-series labels. One more click on Export and the numbers are on their way to Excel, email or your finance system.
Why it matters:
- Trust every insight – verify the raw numbers without leaving your dashboard.
- Share faster – export a clean CSV in one click, no copy-paste needed.
- Save time – filter, sort and download data directly from the chart so you can get on with real work.
How it works:
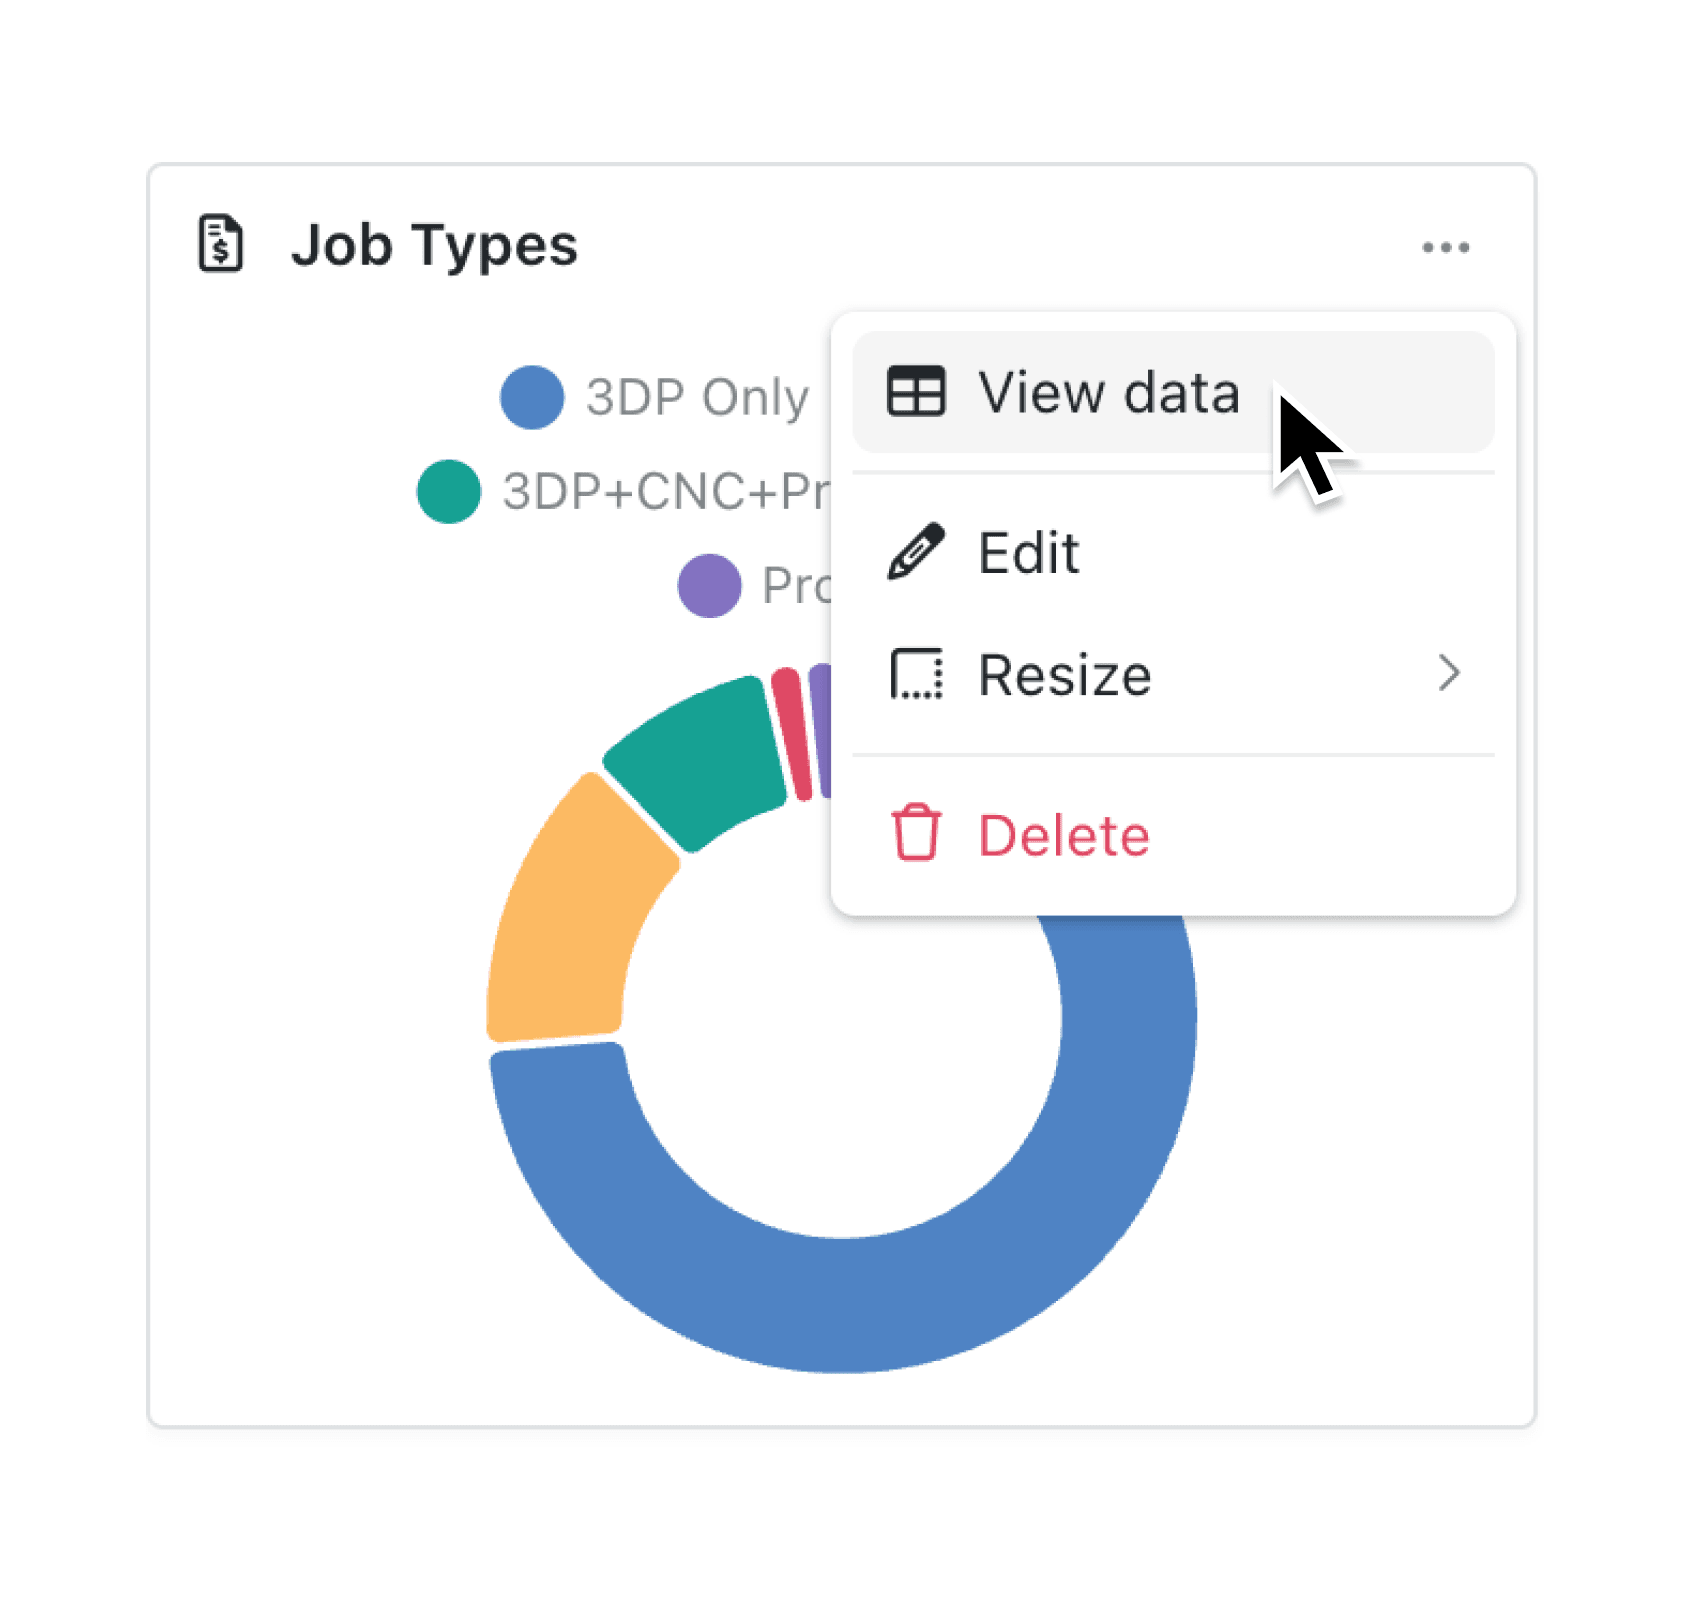
- Click the three dots next to any chart, then select View data from the toolbar or menu.
- A data modal opens showing the full table with correct units, labels and filters applied.
- Click Export to download the table instantly.
When to use it:
- Performance analysis: Analysts download the underlying dashboard data to perform deeper analysis, validate trends, and create custom reports outside the platform.
- Audit and compliance: Finance or compliance teams export dashboard data to retain records, support audits, and verify figures against source systems.
- Data sharing: Managers download dashboard data to share detailed results with stakeholders who need the raw numbers rather than visual summaries.
Try it now in Kinabase → Dashboards → Reports
Have feedback? Email support@kinabase.com — we’re listening.