Product Updates
Stay up to date with our latest product improvements and features
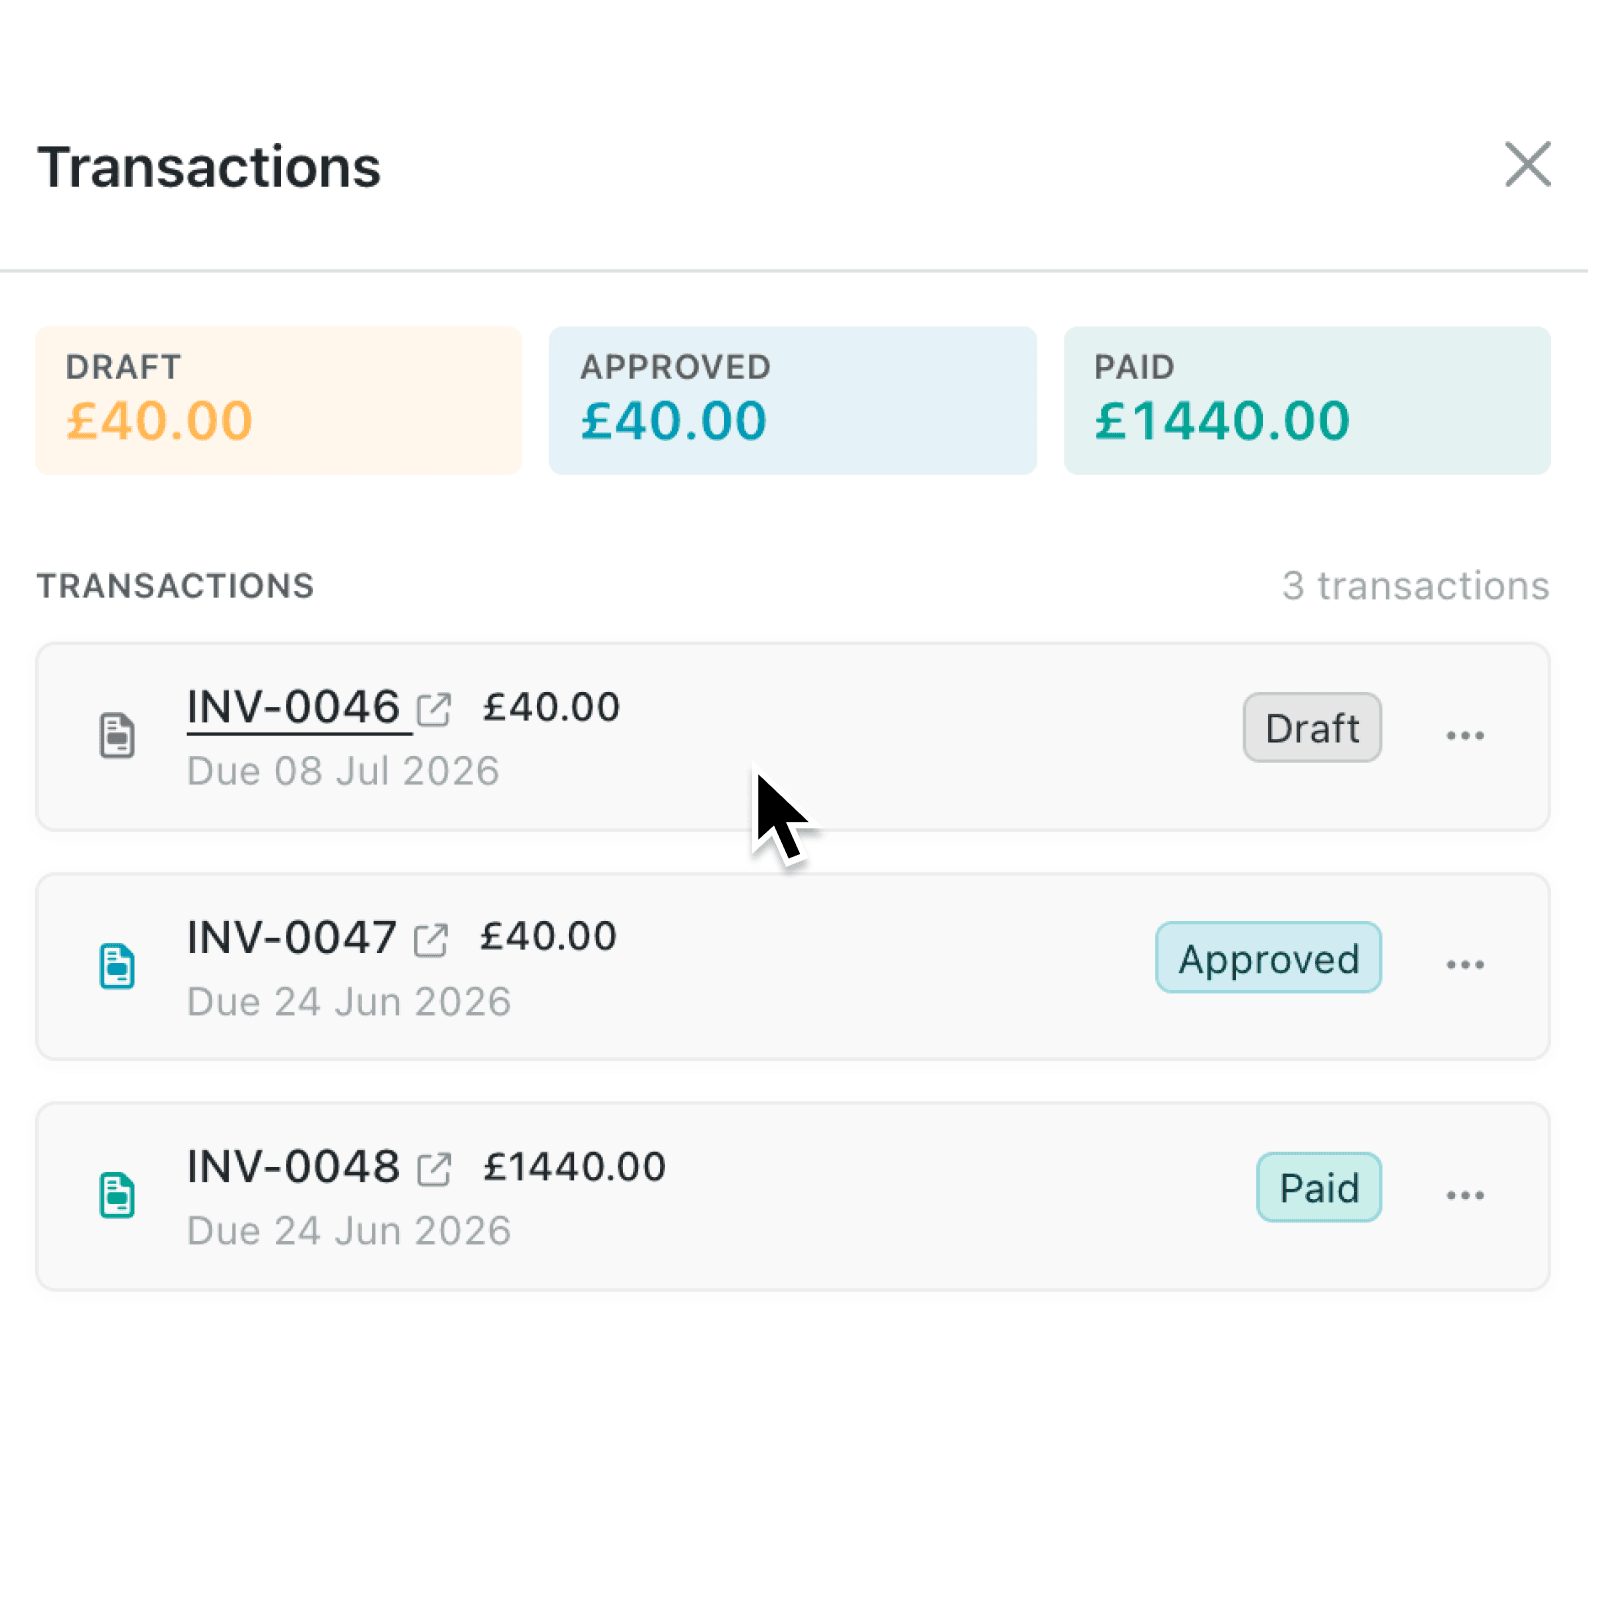
Create and track invoices directly from your records
Create and track invoices directly from your records
Kinabase now lets you create, link, and track invoices and bills from within your records, with live payment status, line-item coverage tracking, and full Xero and QuickBooks integration.
Read updateAutomatically create and link accounting records with automations
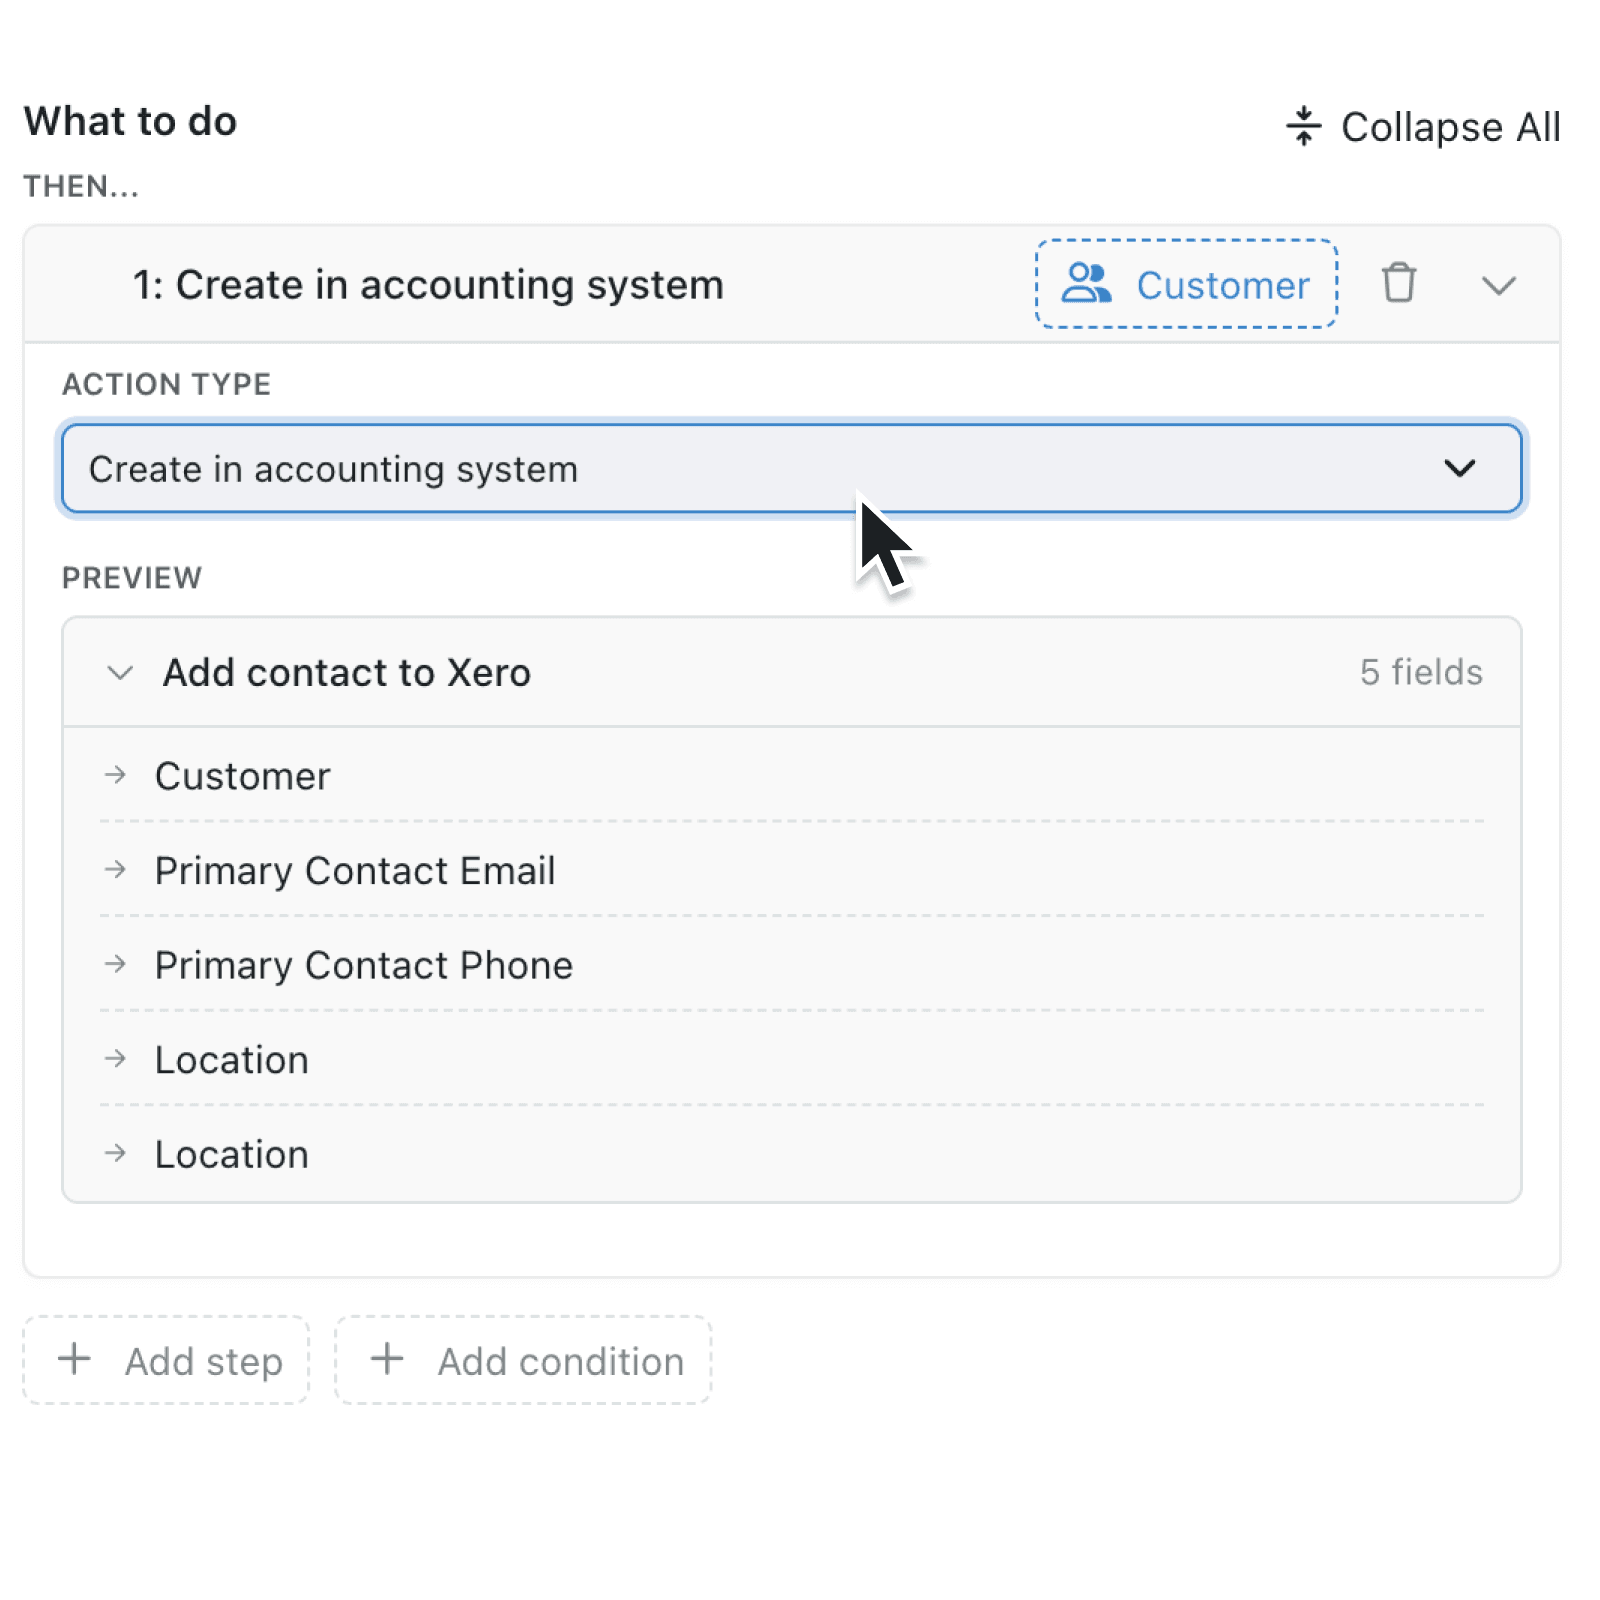
Automatically create and link accounting records with automations
Kinabase automations can now create contacts and products in Xero or QuickBooks automatically and link them back to your records, with built-in duplicate prevention and safe CSV import handling.
Read updateConnect your operations and accounting with Xero and QuickBooks integrations
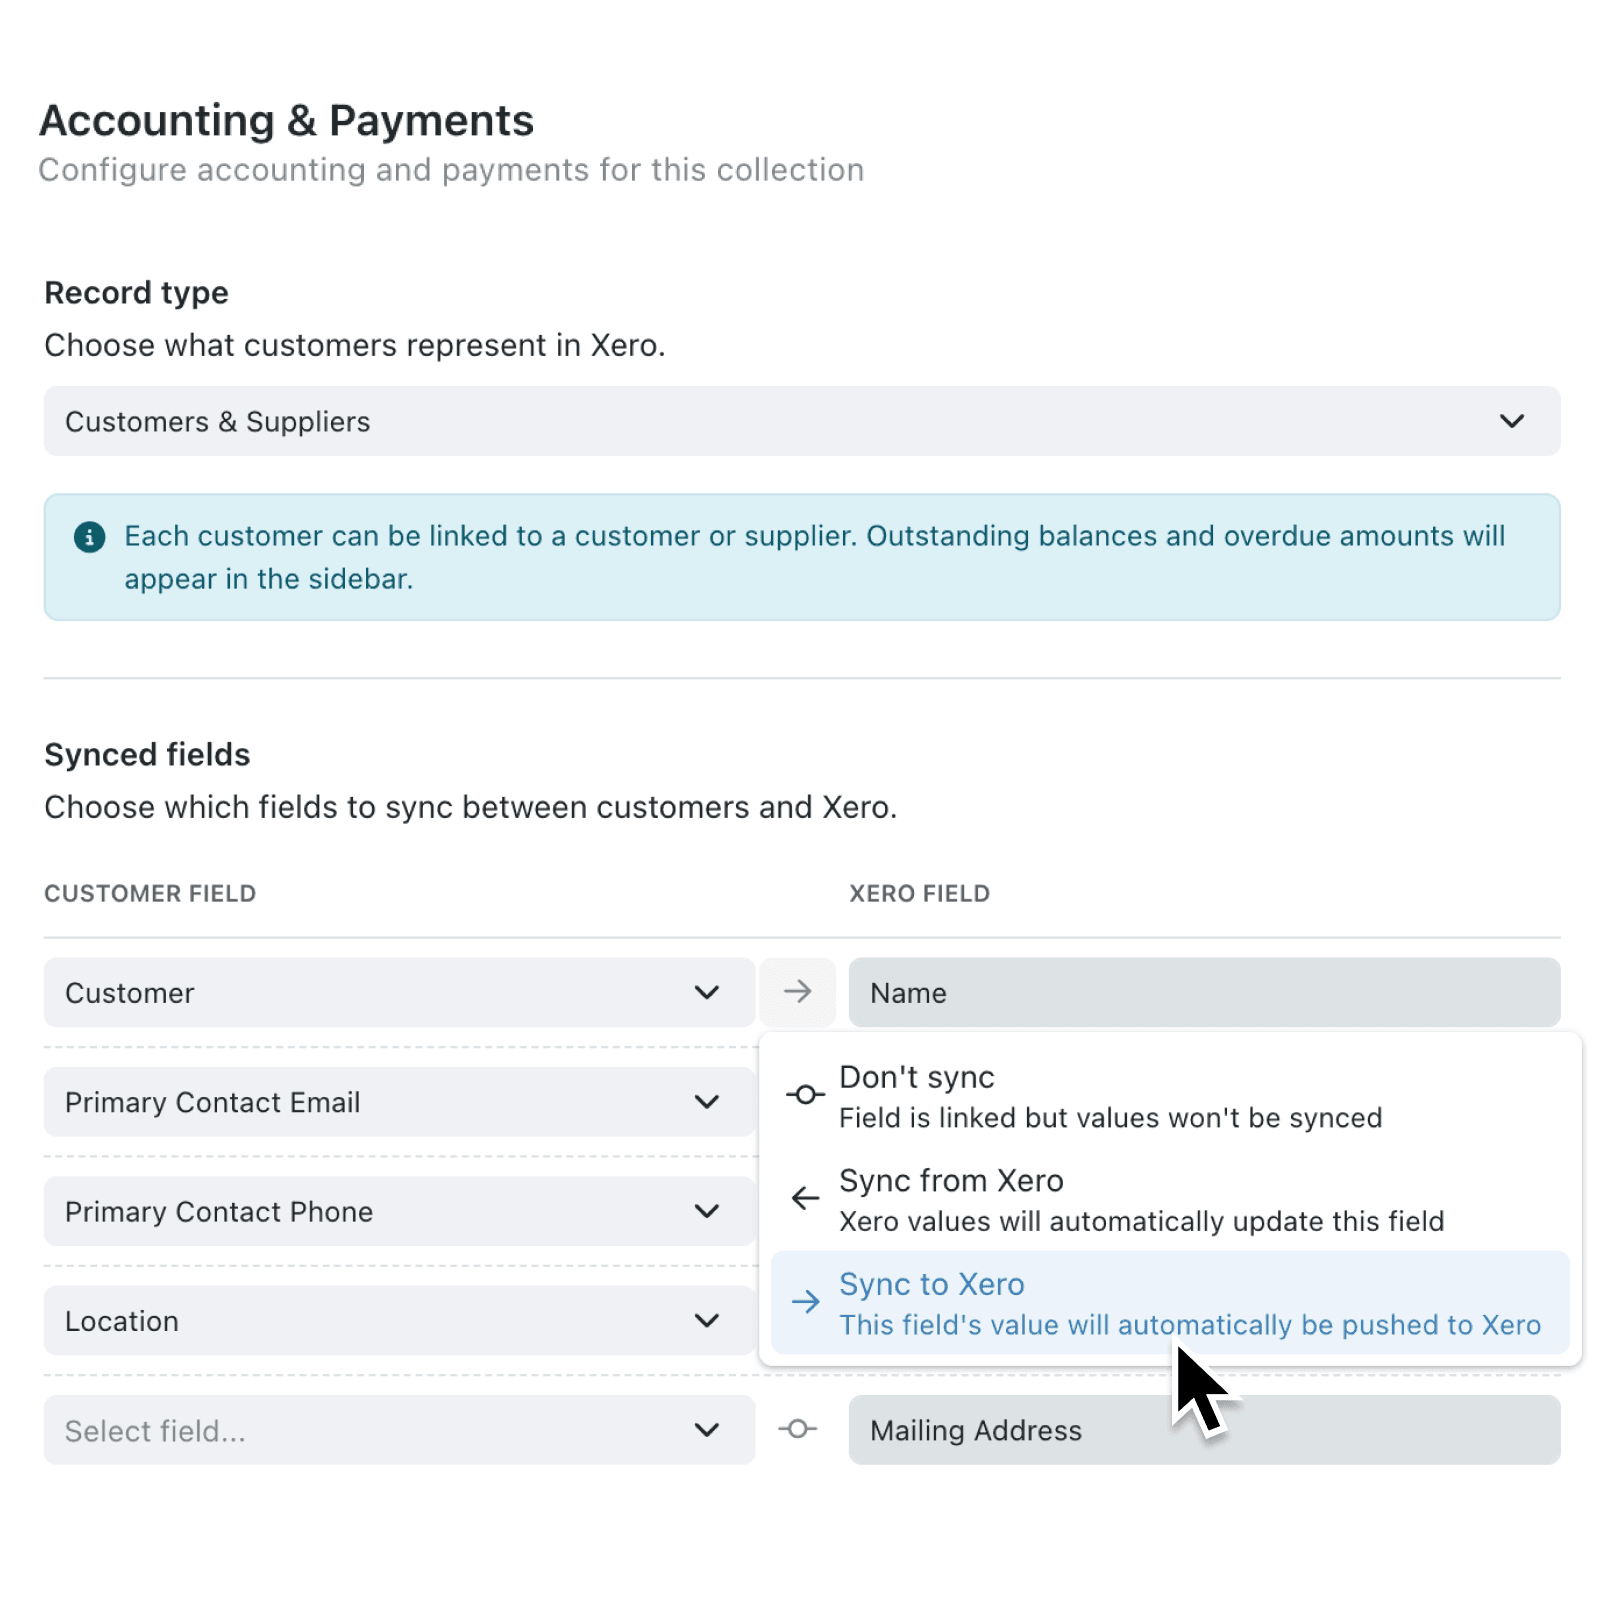
Connect your operations and accounting with Xero and QuickBooks integrations
Connect Kinabase to Xero or QuickBooks to keep customers, suppliers, products, and financial information aligned across your business.
Read updateTransfer reports and tasks when you deactivate a user
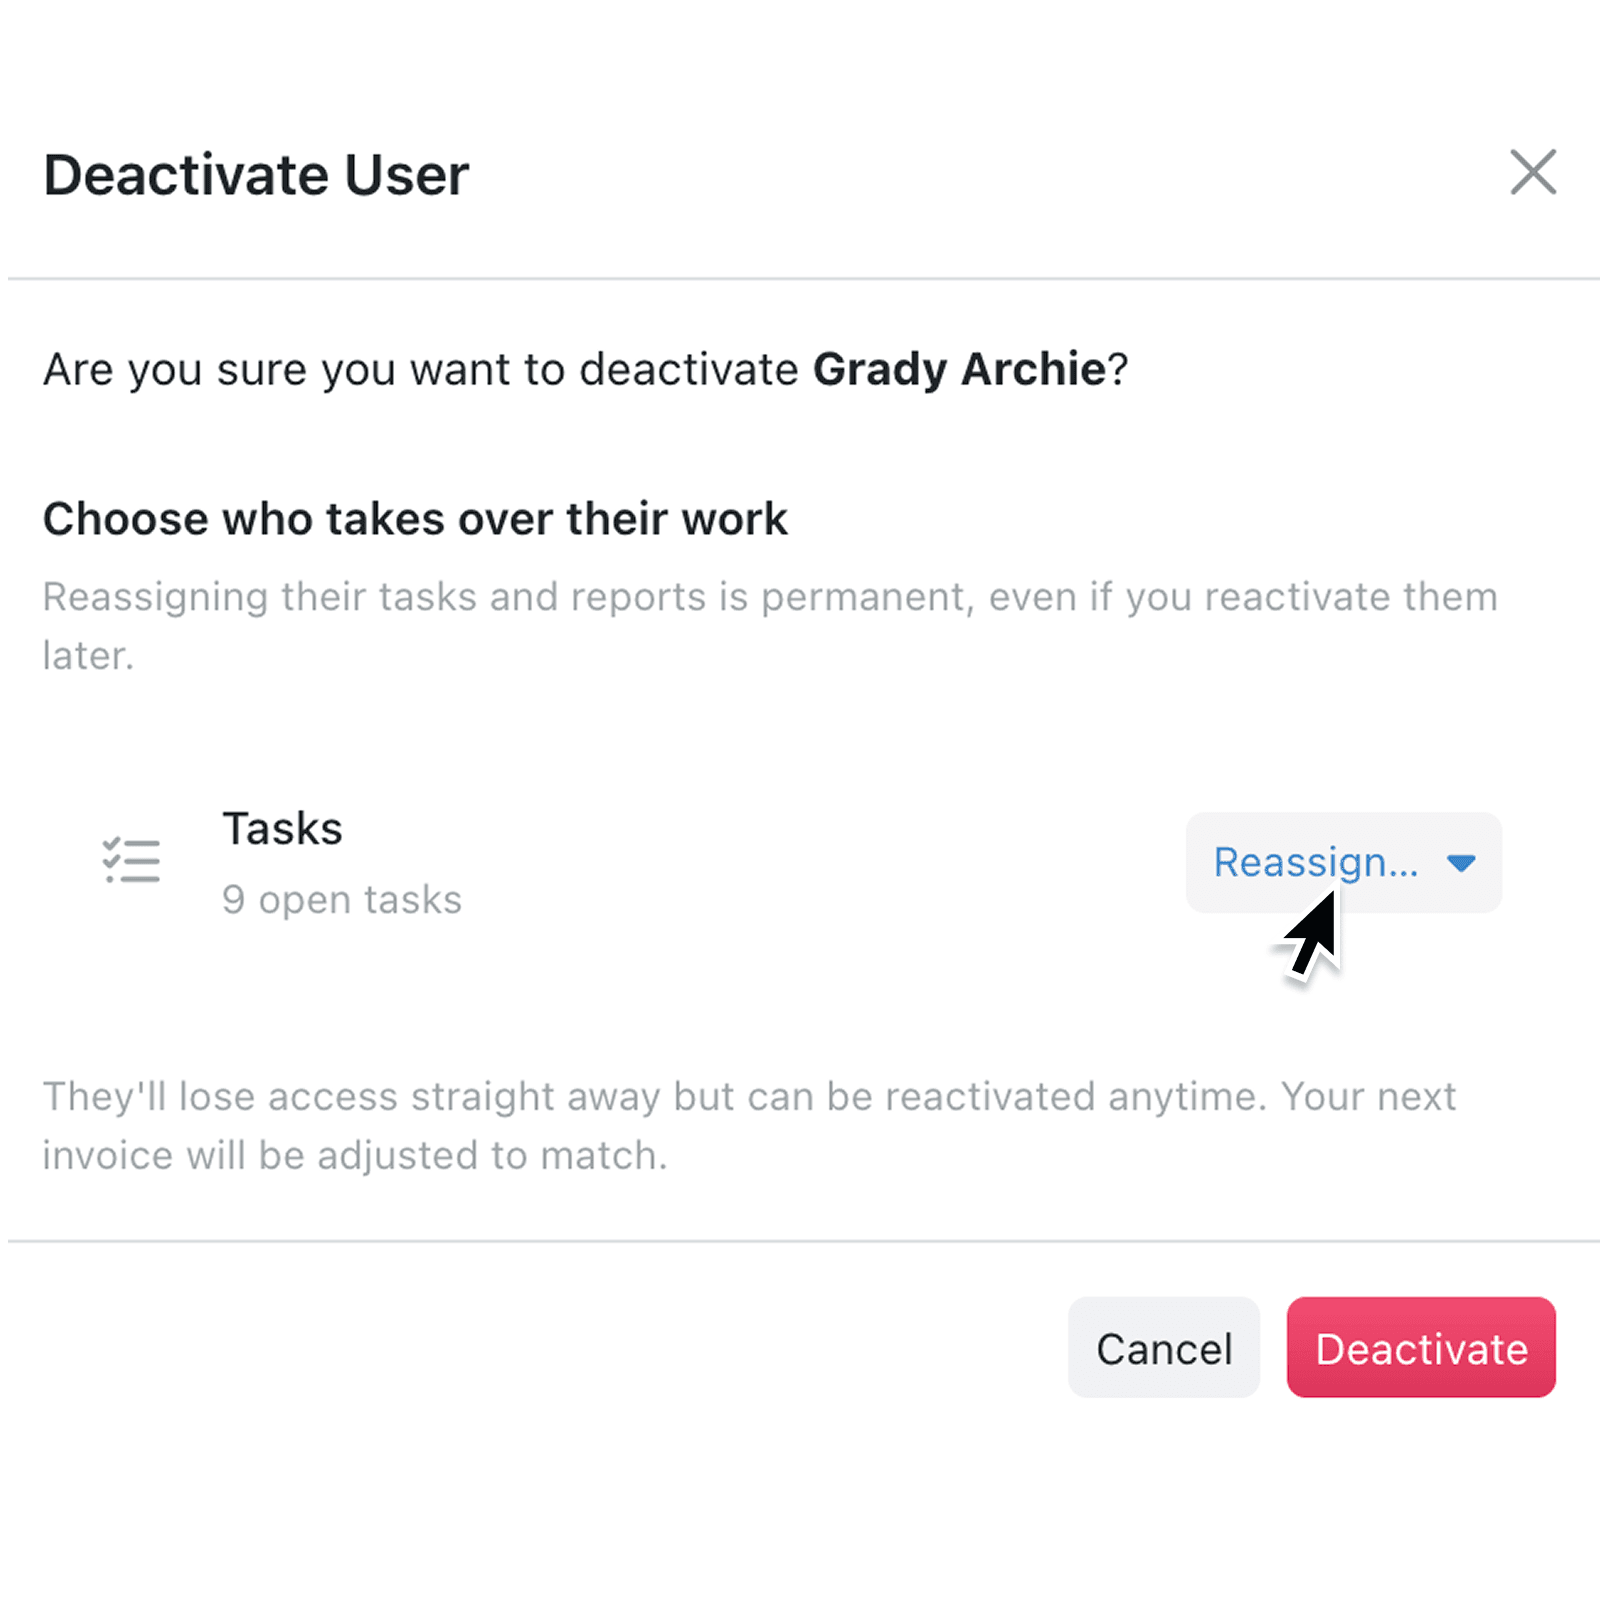
Transfer reports and tasks when you deactivate a user
Deactivating a Colleague now hands their open tasks and personally owned reports to the right person, so nothing important is locked away when someone leaves.
Read updateLog activities and stage changes by voice
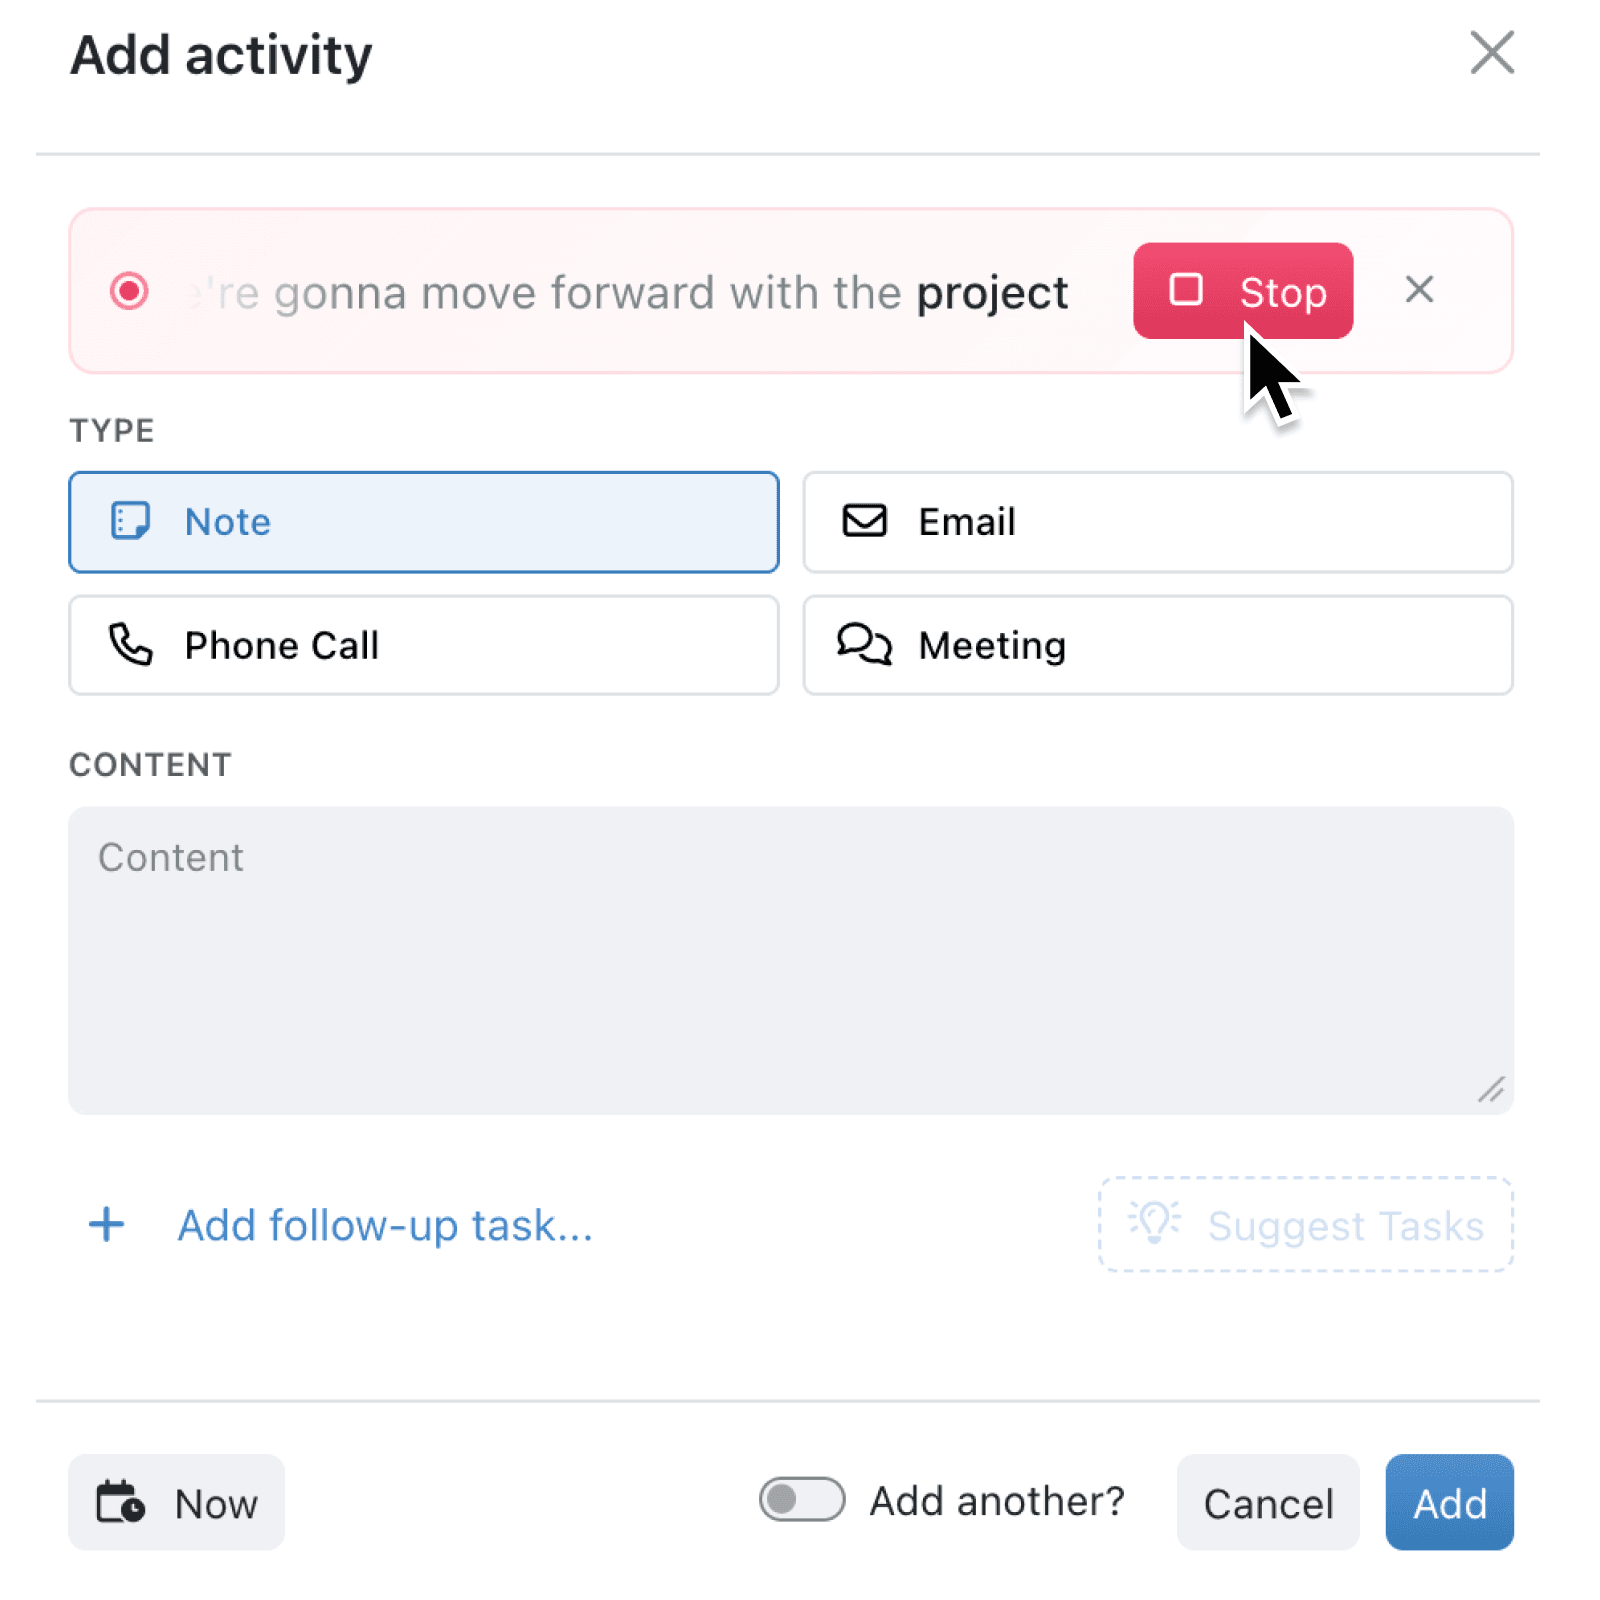
Log activities and stage changes by voice
Dictate your notes and let Kinabase tidy the words, fill the right fields and suggest follow-up tasks across activities and workflow stage changes.
Read update