Stop scrolling through long lists of charts. You can now bundle them into purpose-built collection reports, right where you work. Organise insights by audience, keep permissions tight and surface answers faster.
Collection Reports live inside each Collection, giving small and mid-sized teams a simple, powerful way to turn raw data into action.
Why it matters:
- Find insights faster – switch dashboards from a new toolbar dropdown and focus on only the charts you need.
- Keep each audience on track – set "Just me" or team-wide permissions for every report.
- Stay in flow – add, edit, duplicate or delete dashboards without leaving the Collection view.
How it works:
- Open any collection, click on the Chart icon in the top-right. If you've not already - create a chart by following the instructions.
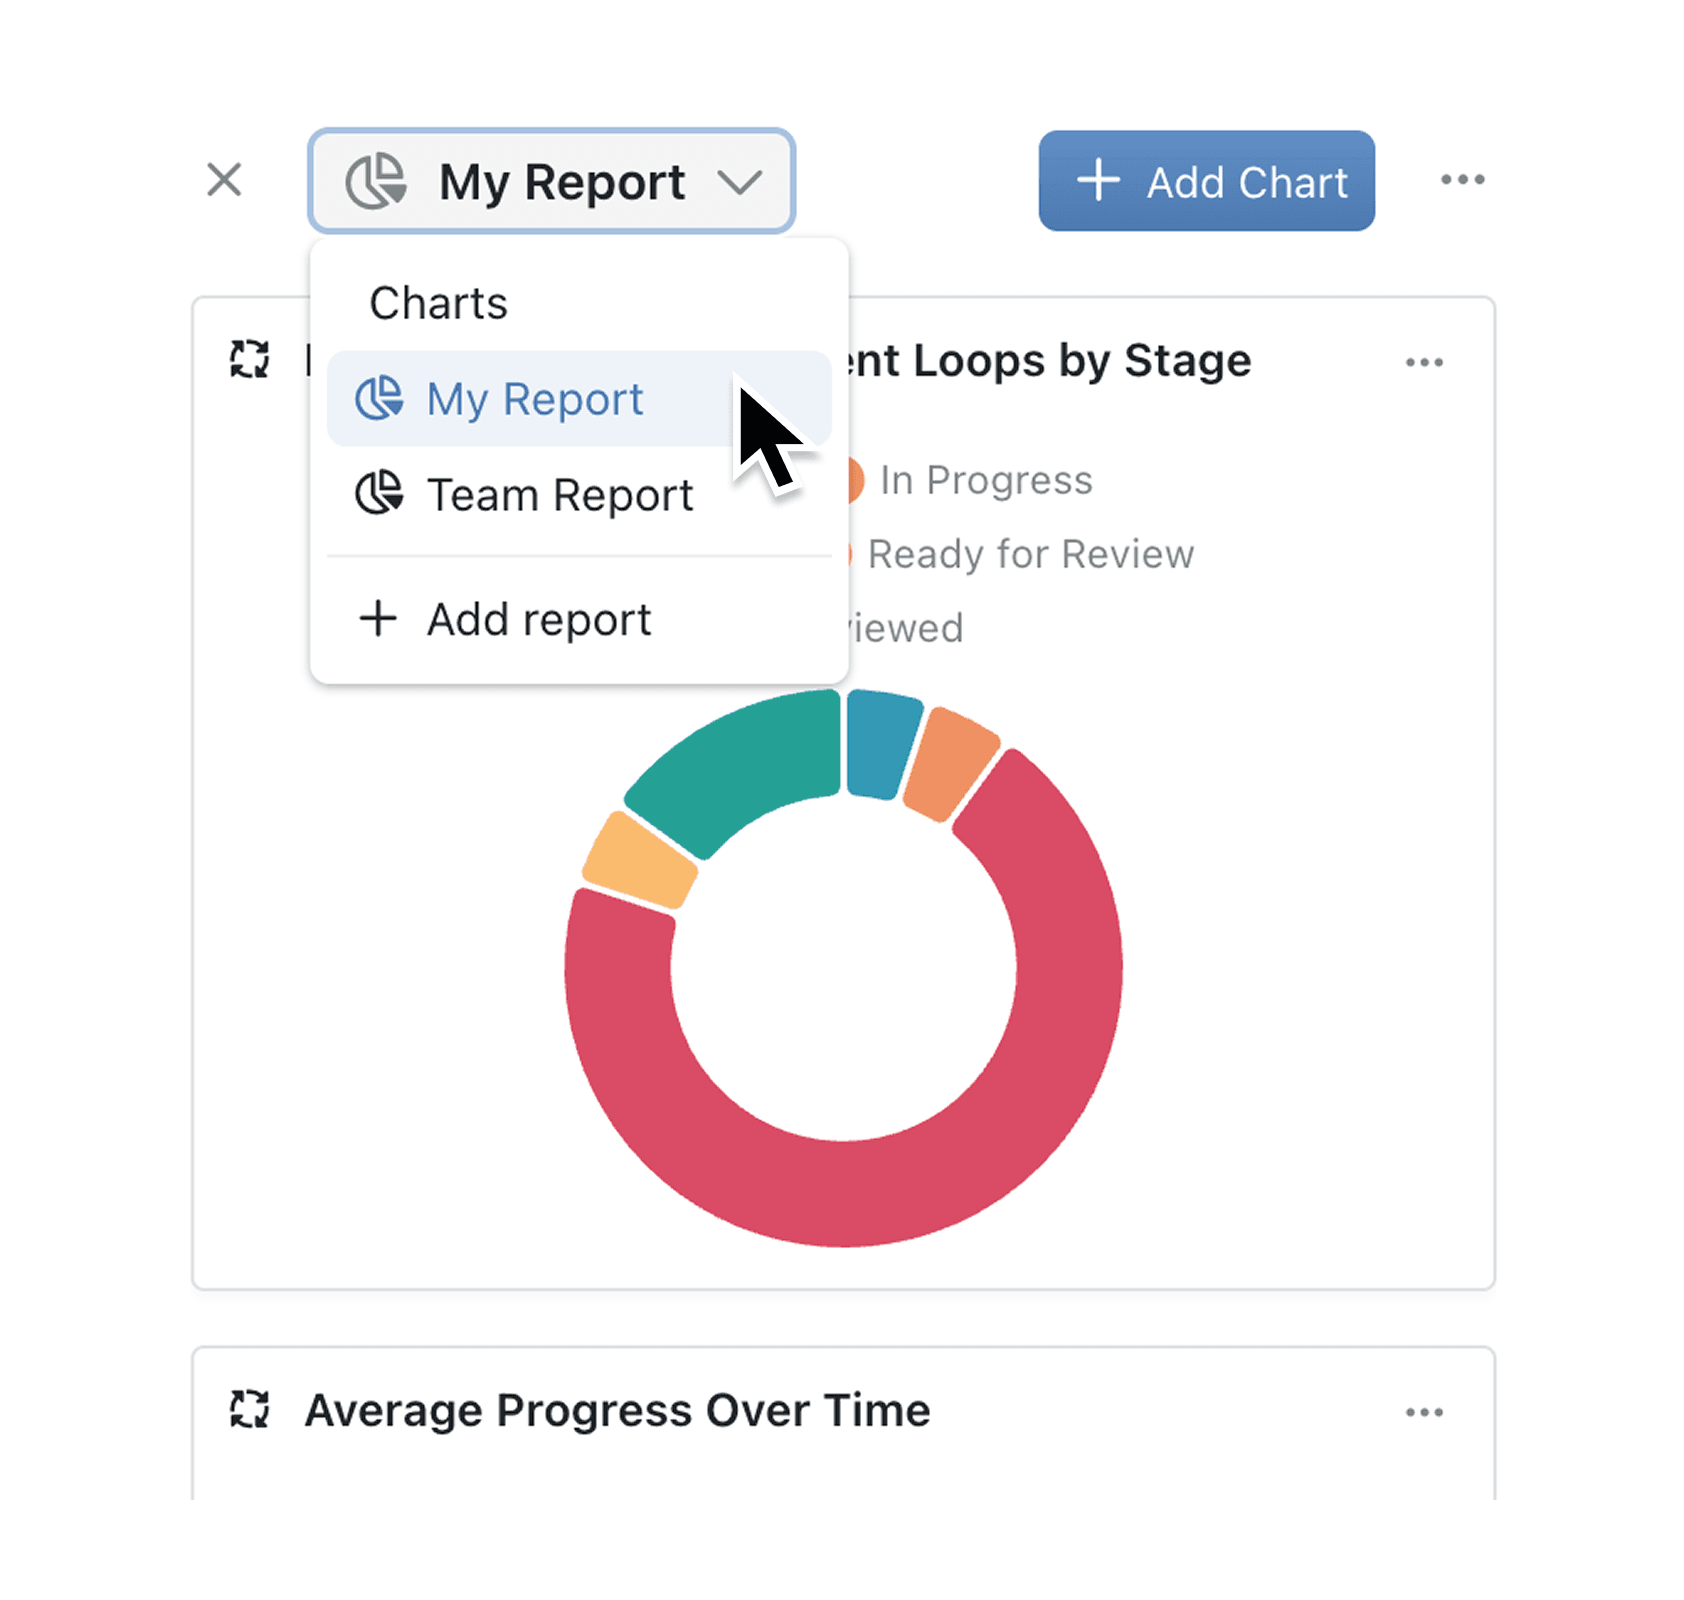
- Choose an existing report or click Add Report to start fresh.
- Configure your Report: Add or duplicate charts; drag to arrange; click ••• to edit, resize or delete the dashboard.
When to use it:
- Project Managers preparing project status charts to stay on top of project performance.
- Managing Directors who handle sensitive data and need a private dashboard before sharing topline numbers.
- Sales Managers who want to track their team's leads privately.
Try it now in Kinabase → Collections → Charts.
Have feedback? Email support@kinabase.com — we’re listening.