
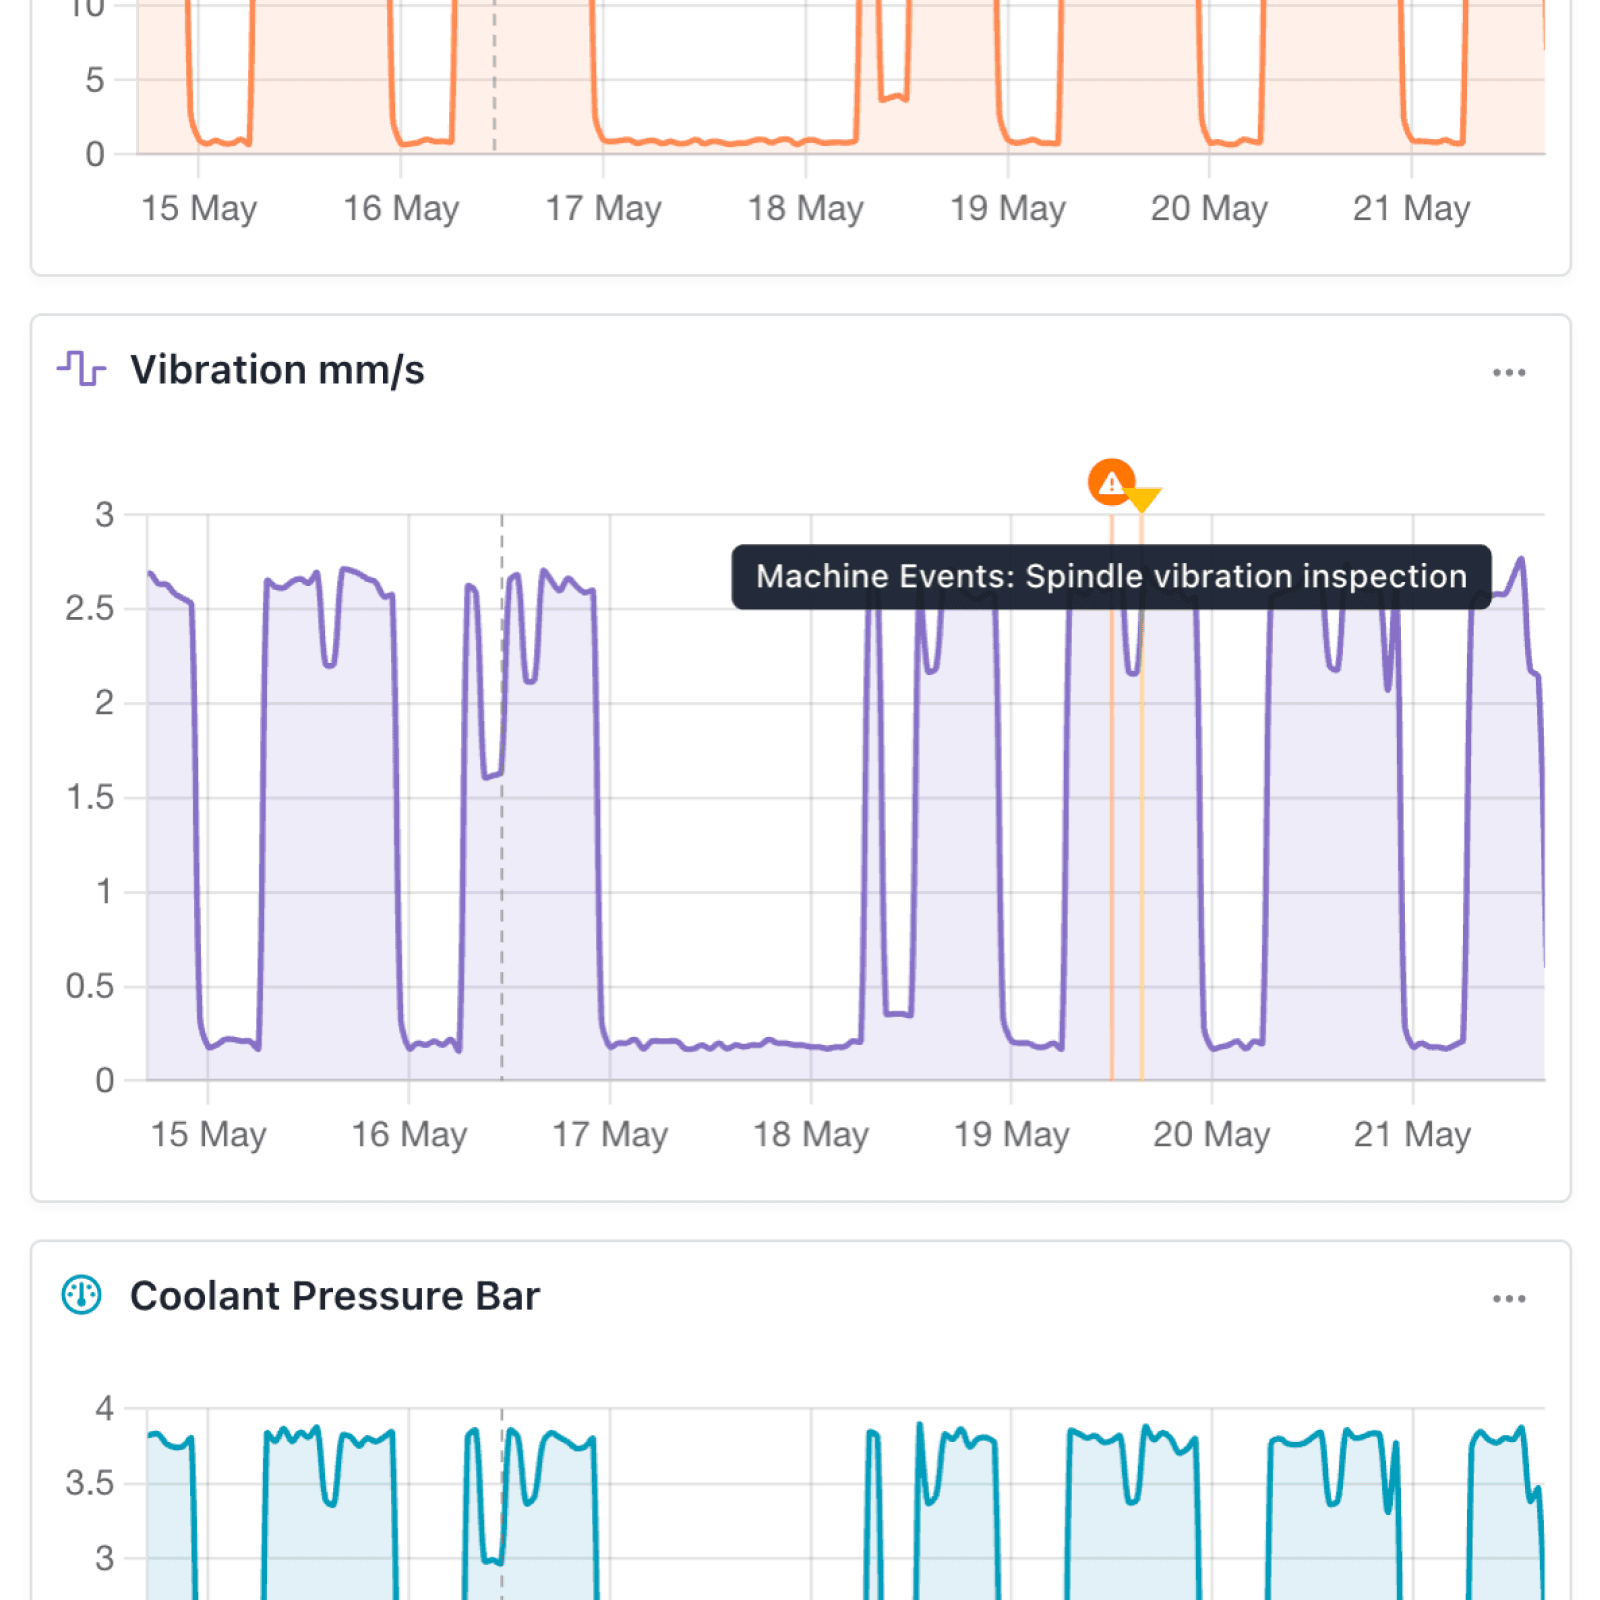
Telemetry charts are great for spotting trends, but raw data rarely tells the full story. A spike or dip often makes sense only when you know the context of that moment: the facility door was opened leading to a drop in temperature, or the tool broke during machining leading to a spike in vibration. With this update, you can now add that context directly on the chart as an annotation and link it to related records and activities.
What's new:
You can now overlay records and activities as annotation marks on telemetry charts. Admins configure annotation sources from related collections, and anyone viewing a record's Telemetry tab will see those events anchored directly on the chart timeline. Click a mark to open the linked record or activity, or use a chart's Annotations menu to drop a new mark at a specific moment in time.
Why it matters:
- Connect events to data so you can immediately see whether a reading lines up with a service visit, inspection, or operator note.
- Capture context in the moment by clicking a chart to add an activity or related record at the exact timestamp you care about.
- Reuse data you already have by surfacing existing collections such as inspections, work orders, or callouts as chart overlays without duplicating records.
- Stay within your permissions because users only see annotation sources and records they are allowed to read, with add or edit options shown only where their role permits.
- Keep charts readable with automatic clustering, icons, colours, and tooltips that group nearby marks and show counts when activity is dense.
How it works:
- Open a collection's Configure page and select the Telemetry pane.
- Under Chart annotations, click Add annotation source and pick a Source collection, a Record field that points back to this collection, and a Date field with day or finer precision.
- Choose a Label, Icon & colour, then set Scope to All charts or Per field to limit the mark to a specific telemetry field.
- Save your changes. You can configure up to ten annotation sources per collection.
- On any record's Telemetry tab, hover a mark for details, click to open the underlying record or activity, or use the chart's Annotations menu to add a new activity or source record at a chosen point in time.
When to use it:
- Operations managers can plot scheduled inspections and service visits over equipment readings to confirm whether interventions match expected outcomes.
- Engineering teams can leave timestamped activities when investigating anomalies so colleagues understand what was tried and observed.
- Account managers can overlay customer meetings or callouts on usage charts to explain shifts in behaviour during reviews.
Get started
Open any collection with telemetry enabled, head to its Telemetry configuration pane, and add your first annotation source.
If you have questions or feedback, we would love to hear from you. Email support@kinabase.com — we're listening.