Knowing the current value of a field is useful, but the real story is often in how it changed. Until now, tracking trends in your Kinabase data meant exporting snapshots or building bespoke reports. Telemetry changes that by recording field history automatically and plotting it on every record.
What's new:
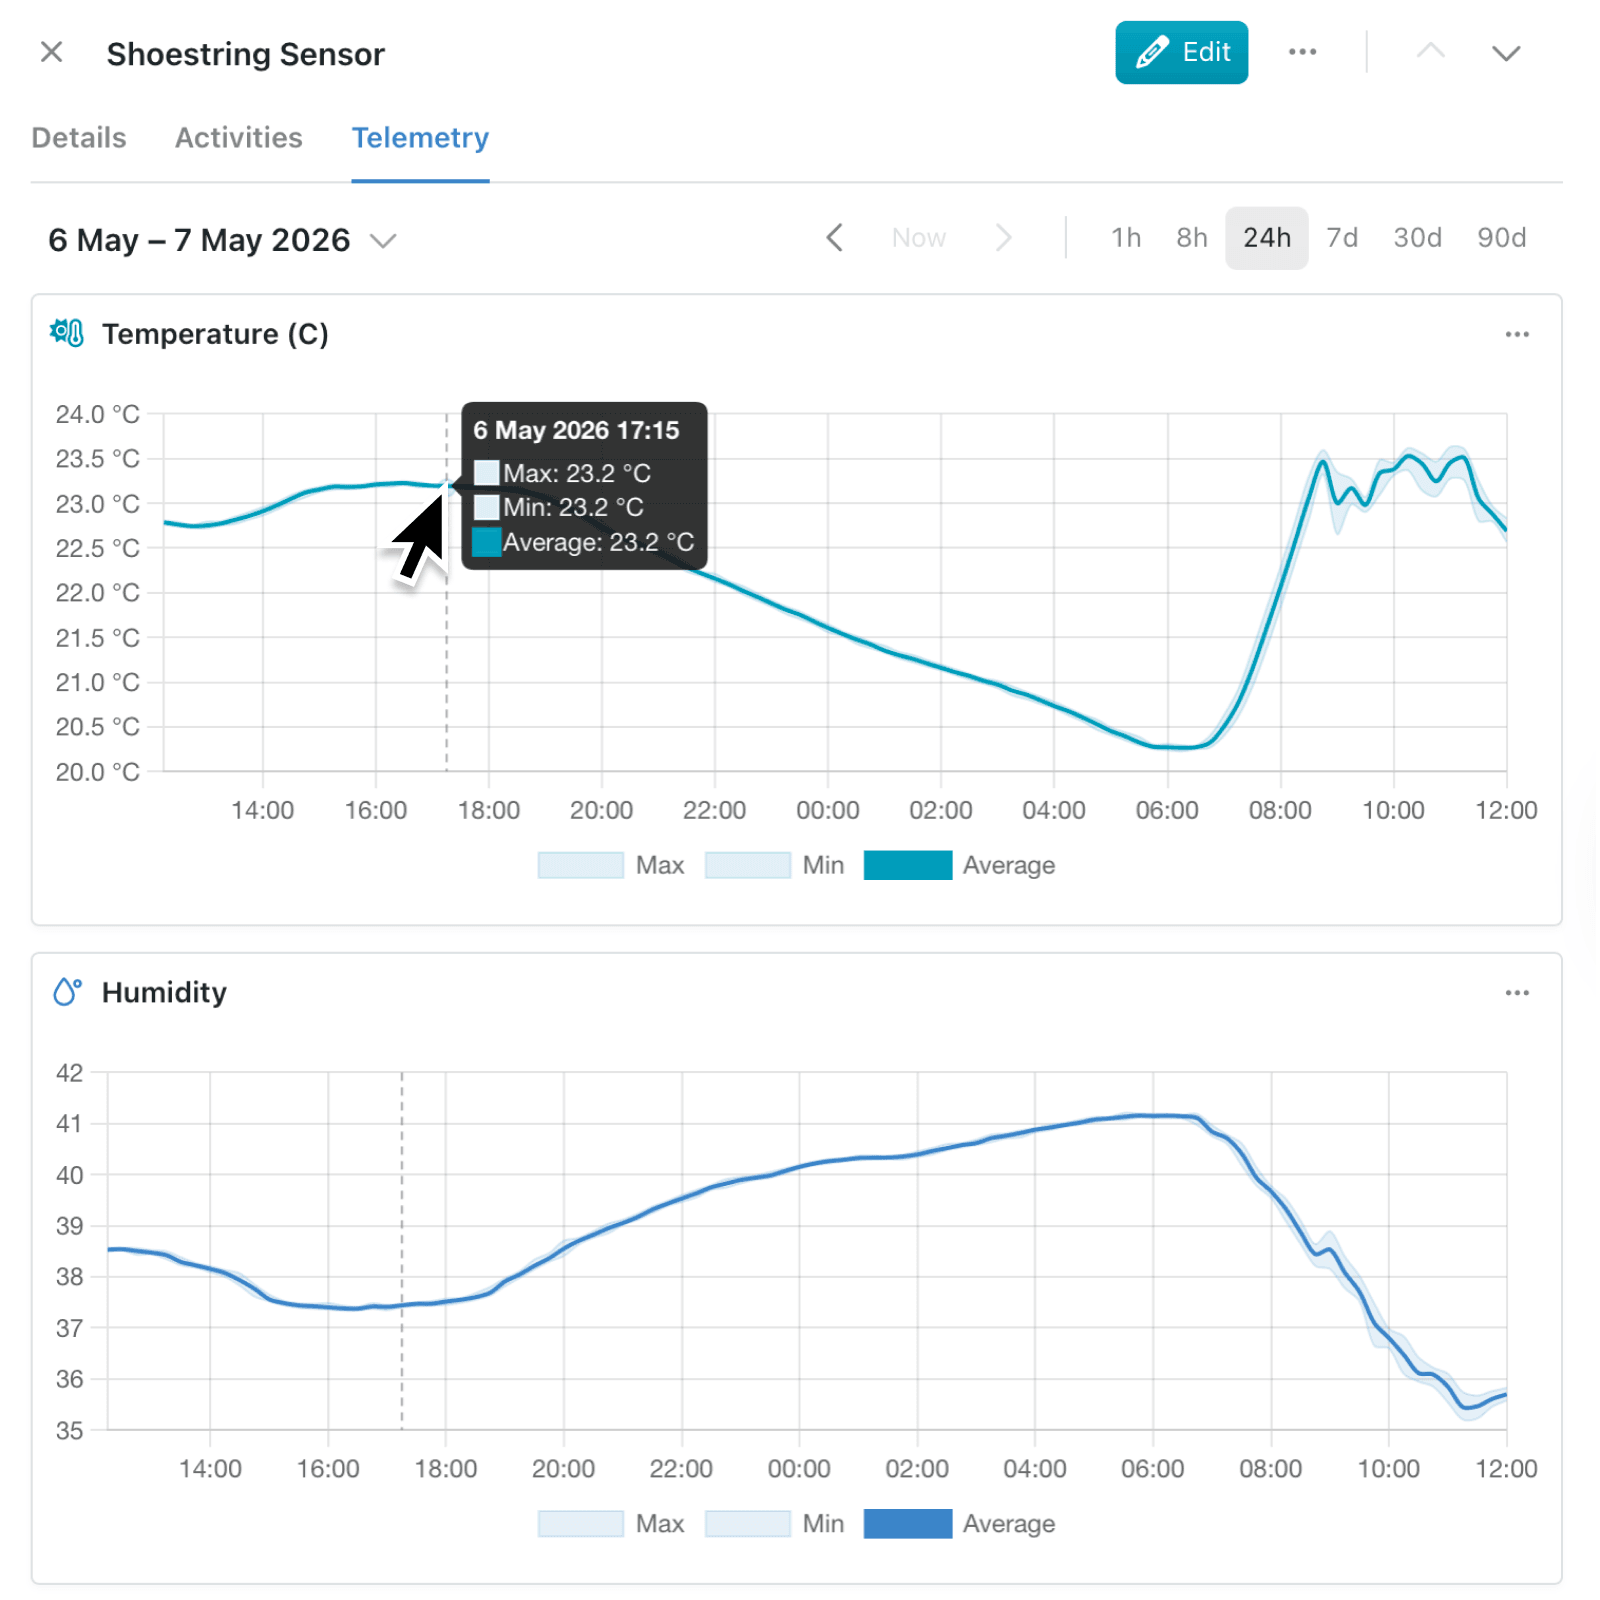
Telemetry is a new feature that tracks eligible fields, including numeric, currency, duration, computed, aggregation, option, stage, and status fields, over time and shows them as interactive charts on a dedicated Telemetry tab. You can enable it per collection, choose how much history to import, and curate which fields appear on the charts.
Why it matters:
- Spot trends instantly by opening any record and watching numbers, stages, and option values move over time without building a report.
- Keep teams aligned because admins curate a single tab layout, so everyone viewing a record sees the same fields in the same order with consistent defaults.
- Import your past by choosing to start tracking from now or backfill the last 30 days, 90 days, a year, or all available history in the background.
- Stay in control by reviewing tiered retention, pausing tracking at any time, and rebuilding history for a single field when its configuration changes.
How it works:
- Open a collection's configuration and choose the Telemetry tab.
- Toggle on Enable telemetry for this collection and pick a backfill window, from Start tracking from now through to All available history.
- Drag your eligible fields into the order you want, then pick each field's default display mode, chart type, line style, icon, colour, and y-axis bounds.
- Click Save layout. Kinabase imports history in the background and a banner keeps you updated on progress.
- Open any record and select the Telemetry tab to explore the charts, pan through time, and zoom in on a specific range.
Note: If a field's history ever needs refreshing, admins can right-click the field in configuration and choose Rebuild telemetry to replay its history for the selected window.
When to use it:
- Operations managers can watch order volumes, stock levels, or job progress climb and fall across the week without leaving the record.
- Sales leaders can see how a deal moved through stages and when key values changed, helping coach the team on what worked.
- Support teams can correlate a customer's ticket history with changes in their account to diagnose recurring problems.
Get started
Head to any collection's configuration, open the Telemetry pane, and turn tracking on. Choose the backfill window that suits you, configure which fields appear, then open a record to explore the new Telemetry tab.
If you have questions or feedback, we would love to hear from you. Email support@kinabase.com — we're listening.